Only Attributes data can be applied to an Attributes control chart.
To see the differences between various attribute charts, let's consider an example of the errors in an accounting process, where each month we process a certain number of transactions.
1) The Np-Chart monitors the number of times a condition occurs, relative to a constant sample size, when each sample can either have this condition, or not have this condition. For our example, we would sample a set number of transactions each month from all the transactions that occurred, and from this sample count the number of transactions that had one or more errors. We would then track on the control chart the number of transactions with errors per month.
2) The p-Chart monitors the percent of samples having the condition, relative to either a fixed or varying sample size, when each sample can either have this condition, or not have this condition. For our example, we might choose to look at all the transactions in the month (since that would vary from month to month), or a set number of samples, whichever we prefer. From this sample, we would count the number of transactions that had one or more errors. We would then track on the control chart the percent of transactions with errors per month.
3) The c-Chart monitors the number of times a condition occurs, relative to a constant sample size. In this case, a given sample can have more than one instance of the condition, in which case we count all the times it occurs in the sample. For our example, we would sample a set number of transactions each month from all the transactions that occurred, and from this sample count the total number of errors in all the transactions. We would then track on the control chart the number of errors in all the sampled transactions per month.
4) The u-Chart monitors the percent of samples having the condition, relative to either a fixed or varying sample size. In this case, a given sample can have more than one instance of the condition, in which case we count all the times it occurs in the sample. For our example, we might choose to look at all the transactions in the month (since that would vary month to month), or a set number of samples, whichever we prefer. From this sample, we count the total number of errors in all the transactions. We would then track on the control chart the number of errors per transactions per month.
Tuesday, 10 November 2009


Six Sigma - Infrastructure
A very powerful feature of Six Sigma is the creation of an infrastructure to ensure that performance improvement activities have the necessary resources.
Failure to provide this infrastructure is the #1 reason why 80% of all TQM implementations failed in the past. Six Sigma makes improvement and change the full-time job of a small but critical percentage of the organization's personnel. These full time change agents are the catalyst that institutionalizes change.
Figure below illustrates the required human resource commitment required by Six Sigma.

Failure to provide this infrastructure is the #1 reason why 80% of all TQM implementations failed in the past. Six Sigma makes improvement and change the full-time job of a small but critical percentage of the organization's personnel. These full time change agents are the catalyst that institutionalizes change.
Figure below illustrates the required human resource commitment required by Six Sigma.

Implementation of Six Sigma
The steps required to successfully implement Six Sigma are -
1. Successful performance improvement must begin with senior leadership. Start by providing senior leadership with training in the principles and tools they need to prepare their organization for success. Simultaneously, steps are taken to "soft-wire" the organization and to cultivate an environment for innovation and creativity. This involves reducing levels of organizational hierarchy, removing procedural barriers to experimentation and change, and a variety of other changes designed to make it easier to try new things without fear of reprisal.
2. Systems are developed for establishing close communication with customers, employees, and suppliers. This includes developing rigorous methods of obtaining and evaluating customer, employee and supplier input. Base line studies are conducted to determine the starting point and to identify cultural, policy, and procedural obstacles to success.
3. Training needs are rigorously assessed. Remedial skills education is provided to assure that adequate levels of literacy and numeracy are possessed by all employees. Top-to-bottom training is conducted in systems improvement tools, techniques, and philosophies.
4. A framework for continuous process improvement is developed, along with a system of indicators for monitoring progress and success. Six Sigma metrics focus on the organization's strategic goals, drivers, and key business processes.
5. Business processes to be improved are chosen by management, and by people with intimate process knowledge at all levels of the organization. Six Sigma projects are conducted to improve business performance linked to measurable financial results. This requires knowledge of the organization's constraints.
6. Six Sigma projects are conducted by individual employees and teams led by Green Belts and assisted by Black Belts.
1. Successful performance improvement must begin with senior leadership. Start by providing senior leadership with training in the principles and tools they need to prepare their organization for success. Simultaneously, steps are taken to "soft-wire" the organization and to cultivate an environment for innovation and creativity. This involves reducing levels of organizational hierarchy, removing procedural barriers to experimentation and change, and a variety of other changes designed to make it easier to try new things without fear of reprisal.
2. Systems are developed for establishing close communication with customers, employees, and suppliers. This includes developing rigorous methods of obtaining and evaluating customer, employee and supplier input. Base line studies are conducted to determine the starting point and to identify cultural, policy, and procedural obstacles to success.
3. Training needs are rigorously assessed. Remedial skills education is provided to assure that adequate levels of literacy and numeracy are possessed by all employees. Top-to-bottom training is conducted in systems improvement tools, techniques, and philosophies.
4. A framework for continuous process improvement is developed, along with a system of indicators for monitoring progress and success. Six Sigma metrics focus on the organization's strategic goals, drivers, and key business processes.
5. Business processes to be improved are chosen by management, and by people with intimate process knowledge at all levels of the organization. Six Sigma projects are conducted to improve business performance linked to measurable financial results. This requires knowledge of the organization's constraints.
6. Six Sigma projects are conducted by individual employees and teams led by Green Belts and assisted by Black Belts.
Six Sigma's magic
Six Sigma's magic isn't in statistical or high-tech razzle-dazzle. Six Sigma relies on tried and true methods that have been around for decades. In fact, Six Sigma discards a great deal of the complexity that characterized Total Quality Management (TQM).
Six Sigma takes a handful of proven methods and trains a small cadre of in-house technical leaders, known as Six Sigma Black Belts, to a high level of proficiency in the application of these techniques. To be sure, some of the methods used by Black Belts are highly advanced, including the use of up-to-date computer technology.
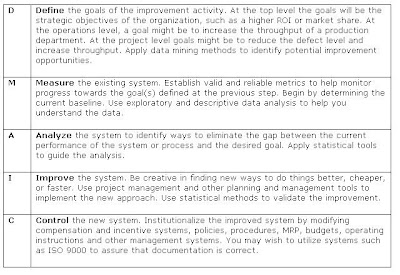
But the tools are applied within a simple performance improvement model known as DMAIC,
Define-Measure-Analyze-Improve-Control. DMAIC can be described as follows:
Six Sigma takes a handful of proven methods and trains a small cadre of in-house technical leaders, known as Six Sigma Black Belts, to a high level of proficiency in the application of these techniques. To be sure, some of the methods used by Black Belts are highly advanced, including the use of up-to-date computer technology.
But the tools are applied within a simple performance improvement model known as DMAIC,
Define-Measure-Analyze-Improve-Control. DMAIC can be described as follows:

Sunday, 8 November 2009
PICK Charts
A PICK Chart is used when a team is faced with multiple improvement ideas. The tool helps solve such issues related to deciding which ideas should be implemented. There are four categories on a 2 x 2 matrix. On the scale, the horizontal axis has scale of payoff or benefits and vertical axis has ease of implementation. Next, the decision needs to be taken as to where the idea falls on the PICK Chart by categorizing them under actions such as Possible, Implement, Challenge, and Kill.
The actions are classified as:
A) Low payoff, easy to do – Possible
B) High payoff, easy to do – Implement
C) High payoff, hard to do – Challenge
D) Low payoff, hard to do – Kill
The vertical axis represents ease of implementation that would include an assessment of cost to implement as well. The more expensive actions are more difficult to implement. For a look at sample PICK Chart templates, refer to this article containing links to downloadable Six Sigma templates.
Usage of PICK Charts
The PICK Chart tool is used when evaluating pre-process unprocessed data. The method enables the user to reduce huge amounts of raw data to get to the base problem. The PICK Chart is most frequently used during the pre-processing phase of Six Sigma after the data collection stage.
There are numerous techniques to process data. One of the ways is to focus on a sample and condense the information for a particular purpose. The process starts by assessing customer feedback. The data is broken down into the needs and is often known as pre-processing.
The step mainly includes analyzing consumer responses and extracting key phrases to verify the needs and their context. The records are kept systematically and highlighted in different colors as per their needs and context to ensure traceability to their unique starting place. This will help in organizing the data for further characterization.
After the completion of the stage, if there is still a lot of data left, it may be compulsory to cut the data further while maintaining an appropriate representative sample. This helps save energy and time in the long run.
The steps that need to be followed to create a PICK Chart are:
Step 1: On a chart, place the subject question. The question needs to be asked and answered by the team at different stages to be sure that the data that is collected is relevant.
Step 2: Put each component of the data on a different note like a post-it or small cards. These notes should be arranged on the left side of the chart.
Step 3: Each team member must read all notes individually and consider its importance. The team member should decide whether the element should or should not remain a fraction of the significant sample. The notes are then removed and moved to the other side of the chart. Now, the data is condensed enough to be processed for a particular purpose by means of tools like Net-Touch, Affinity Diagrams, or KJ Analysis.
- All team members write open-ended questions that are addressed to the learning objectives.
- All team members have their own notes.
- The mediator randomly picks one note from the group.
- After the note is read, the mediator asks the group if anyone has a query that belongs with the one just read.
- Since all team members are familiar with their own notes, efficiency is provided.
- The mediator collects all notes that are offered and forms a cluster with the original note.
- The step is repeated until all notes have set themselves in the cluster.
- These large clusters are subdivided in small groups and have titles
The actions are classified as:
A) Low payoff, easy to do – Possible
B) High payoff, easy to do – Implement
C) High payoff, hard to do – Challenge
D) Low payoff, hard to do – Kill
The vertical axis represents ease of implementation that would include an assessment of cost to implement as well. The more expensive actions are more difficult to implement. For a look at sample PICK Chart templates, refer to this article containing links to downloadable Six Sigma templates.
Usage of PICK Charts
The PICK Chart tool is used when evaluating pre-process unprocessed data. The method enables the user to reduce huge amounts of raw data to get to the base problem. The PICK Chart is most frequently used during the pre-processing phase of Six Sigma after the data collection stage.
There are numerous techniques to process data. One of the ways is to focus on a sample and condense the information for a particular purpose. The process starts by assessing customer feedback. The data is broken down into the needs and is often known as pre-processing.
The step mainly includes analyzing consumer responses and extracting key phrases to verify the needs and their context. The records are kept systematically and highlighted in different colors as per their needs and context to ensure traceability to their unique starting place. This will help in organizing the data for further characterization.
After the completion of the stage, if there is still a lot of data left, it may be compulsory to cut the data further while maintaining an appropriate representative sample. This helps save energy and time in the long run.
The steps that need to be followed to create a PICK Chart are:
Step 1: On a chart, place the subject question. The question needs to be asked and answered by the team at different stages to be sure that the data that is collected is relevant.
Step 2: Put each component of the data on a different note like a post-it or small cards. These notes should be arranged on the left side of the chart.
Step 3: Each team member must read all notes individually and consider its importance. The team member should decide whether the element should or should not remain a fraction of the significant sample. The notes are then removed and moved to the other side of the chart. Now, the data is condensed enough to be processed for a particular purpose by means of tools like Net-Touch, Affinity Diagrams, or KJ Analysis.
- All team members write open-ended questions that are addressed to the learning objectives.
- All team members have their own notes.
- The mediator randomly picks one note from the group.
- After the note is read, the mediator asks the group if anyone has a query that belongs with the one just read.
- Since all team members are familiar with their own notes, efficiency is provided.
- The mediator collects all notes that are offered and forms a cluster with the original note.
- The step is repeated until all notes have set themselves in the cluster.
- These large clusters are subdivided in small groups and have titles
Kaizen Philosophy
Kaizen means improvements. Kaizen philosophy is practiced in industry for getting big cumulative organizational level improvement by achieving small improvements at the team member level first. For leading a Kaizen, you need to be a disciplined leader who can work with the team and is capable of bringing changes.
What is Kaizen ?
The Japanese word “Kaizen” means “improvement.” The Kaizen philosophy is applied for manufacturing activities, business management activities, service offerings, or even for various activities of human life. Kaizen is a regular activity aimed not only for short term production improvements but also humanizes the work place by eliminating overly hard workloads, provided it is practiced correctly throughout the work place. In case you happen to lead a Kaizen team, the following three skills will be helpful for leading a Kaizen successfully.
1. Be the Change
If you want to have a clean workplace, throw the dirty piece of paper fromn the floor in to the dust bin. If you want your team to lessen their chit-chat time, reduce your own frequency and duration for coffee breaks. Keep in mind that your smallest gestures will also be observed and they will affect your team’s attitude. Be the role model and set the example that you want your team to follow. Kaizen is all about bringing small but continuous improvements through the team members to the team to the organization.
2. Be a Real Team Player
From setting the goals to solving problems and achieving improvements, you and your team members should be equally involved. You should be acting like a teacher for generating ideas from your team members. You will be really blessed if you have a team willed with bright, motivated, and talented people. Otherwise, your success as a Kaizen leader will depend totally upon how well you are able to increase the knowledge, skills, and participation of your team members.
3. Communication
Use all modes of communication, including speaking, listening, doing, expressing and appreciating. Your intentions regarding improvements should be well known to your team members and known well in advance. As a Kaizen leader, you should develop a credible reputation that demonstrate to your people that you are there to see them succeed.
What is Kaizen ?
The Japanese word “Kaizen” means “improvement.” The Kaizen philosophy is applied for manufacturing activities, business management activities, service offerings, or even for various activities of human life. Kaizen is a regular activity aimed not only for short term production improvements but also humanizes the work place by eliminating overly hard workloads, provided it is practiced correctly throughout the work place. In case you happen to lead a Kaizen team, the following three skills will be helpful for leading a Kaizen successfully.
1. Be the Change
If you want to have a clean workplace, throw the dirty piece of paper fromn the floor in to the dust bin. If you want your team to lessen their chit-chat time, reduce your own frequency and duration for coffee breaks. Keep in mind that your smallest gestures will also be observed and they will affect your team’s attitude. Be the role model and set the example that you want your team to follow. Kaizen is all about bringing small but continuous improvements through the team members to the team to the organization.
2. Be a Real Team Player
From setting the goals to solving problems and achieving improvements, you and your team members should be equally involved. You should be acting like a teacher for generating ideas from your team members. You will be really blessed if you have a team willed with bright, motivated, and talented people. Otherwise, your success as a Kaizen leader will depend totally upon how well you are able to increase the knowledge, skills, and participation of your team members.
3. Communication
Use all modes of communication, including speaking, listening, doing, expressing and appreciating. Your intentions regarding improvements should be well known to your team members and known well in advance. As a Kaizen leader, you should develop a credible reputation that demonstrate to your people that you are there to see them succeed.
Five Laws of Lean Six Sigma
The Five Laws of Lean Six Sigma have been formulated to provide a path for quality improvement efforts. In addition to this, these laws help in the enhancement of business processes that aim to improve customer satisfaction. These laws have been accumulated by mixing ideas of Six Sigma and Lean Manufacturing.
Five Laws of Lean Six Sigma
1) Zeroth Law: The Law of the Market
The zeroth law acts like the base law and all other laws have been formulated using the principles of this law. This law is the starting point and is rightly indispensable. The law states that “Customer Critical to Quality” defines quality, that is, the main concern for improvement. This is followed by Return on Invested Capital (ROIC) and Net Present Value (NPV).
2) First Law: The Law of Flexibility
The first law states that the speed of any process is comparative to the flexibility or elasticity of the process. This means that more receptiveness of the process and flexibility to adapt to changes better would be the progress of the project implementation.
3) Second Law: The Law of Focus
The second law states that twenty percent of the activities in a process cause eighty per cent of the delay. This law is related to the Pareto Principle. The statement is interpreted as the main cause of delay in activities is originated from twenty percent of activities. This allows a faster re-focus during the re-orientation phase.
4) Third Law: The Law of Velocity
The third law defines the velocity of the process. It states that the process is inversely proportional to the amount of work-in-progress. This ensures that the work is completed in the fastest possible time and delivered promptly. The Law of Velocity is also commonly known as the Little’s Law. The law explains how the inertia of work-in-progress bears heavily on the speed of project implementation. It is important to know; the higher the number of unfinished tasks, the lower would be the speed of progress due to various ground level handicaps.
5) Fourth Law: The Law of Complexity
The fourth law is defined as the complexity of the service or product offering adds more non-value, costs, and work-in-progress than either poor quality or low sigma or slow speed process problems. Thus, the higher the complexity of the job, the more you see excess costs and work being incurred.
Five Laws of Lean Six Sigma
1) Zeroth Law: The Law of the Market
The zeroth law acts like the base law and all other laws have been formulated using the principles of this law. This law is the starting point and is rightly indispensable. The law states that “Customer Critical to Quality” defines quality, that is, the main concern for improvement. This is followed by Return on Invested Capital (ROIC) and Net Present Value (NPV).
2) First Law: The Law of Flexibility
The first law states that the speed of any process is comparative to the flexibility or elasticity of the process. This means that more receptiveness of the process and flexibility to adapt to changes better would be the progress of the project implementation.
3) Second Law: The Law of Focus
The second law states that twenty percent of the activities in a process cause eighty per cent of the delay. This law is related to the Pareto Principle. The statement is interpreted as the main cause of delay in activities is originated from twenty percent of activities. This allows a faster re-focus during the re-orientation phase.
4) Third Law: The Law of Velocity
The third law defines the velocity of the process. It states that the process is inversely proportional to the amount of work-in-progress. This ensures that the work is completed in the fastest possible time and delivered promptly. The Law of Velocity is also commonly known as the Little’s Law. The law explains how the inertia of work-in-progress bears heavily on the speed of project implementation. It is important to know; the higher the number of unfinished tasks, the lower would be the speed of progress due to various ground level handicaps.
5) Fourth Law: The Law of Complexity
The fourth law is defined as the complexity of the service or product offering adds more non-value, costs, and work-in-progress than either poor quality or low sigma or slow speed process problems. Thus, the higher the complexity of the job, the more you see excess costs and work being incurred.
Subscribe to:
Posts (Atom)

 Posts
Posts


